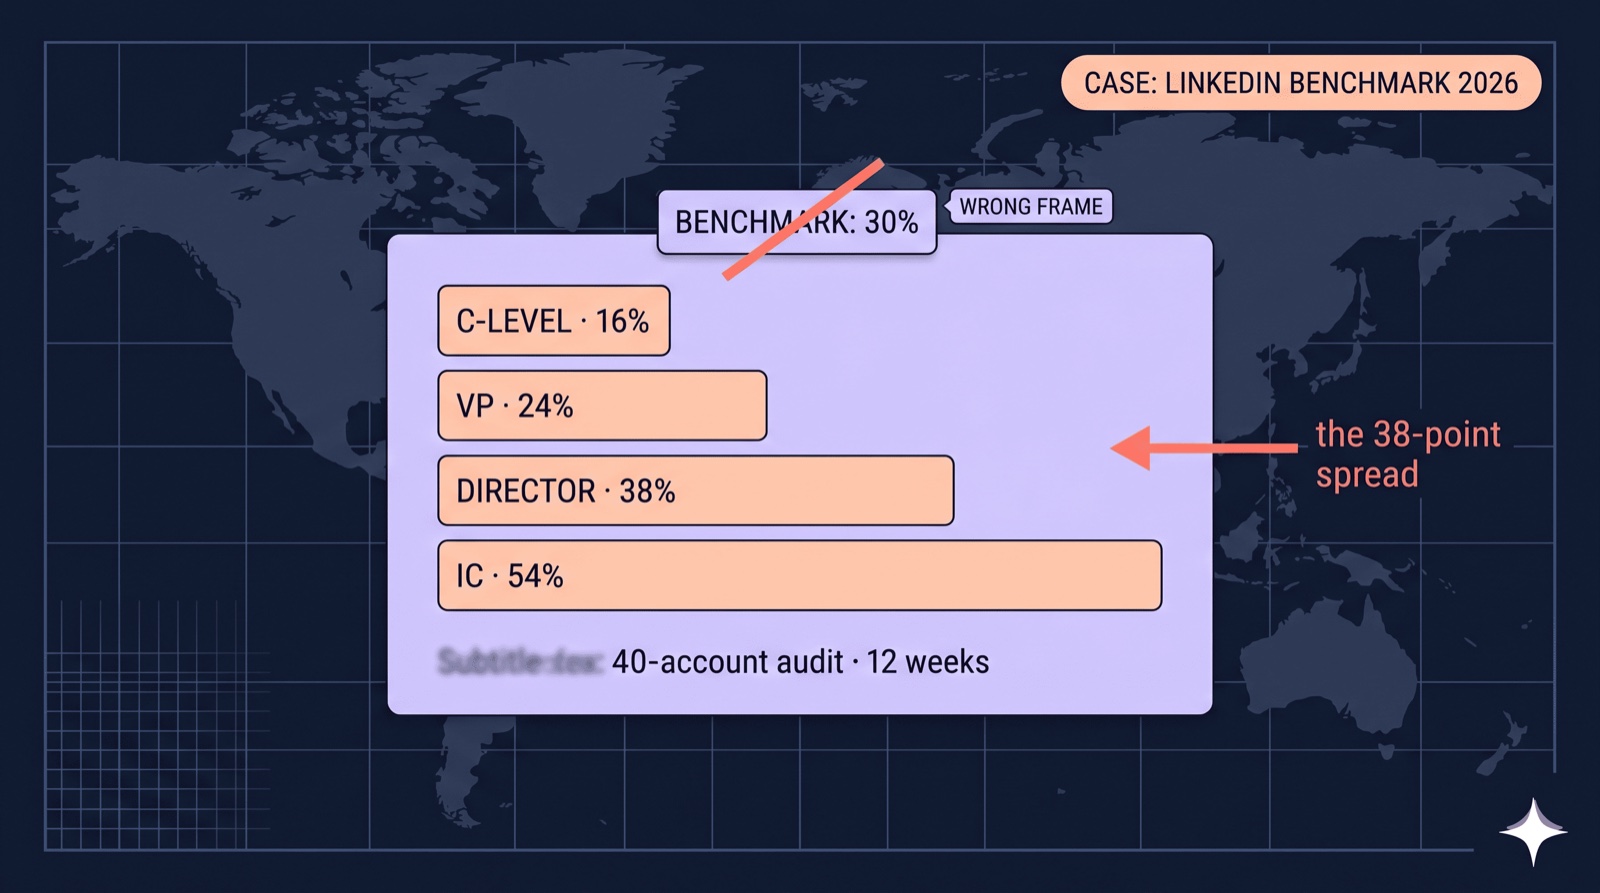
Across 40 B2B outbound accounts we audited over a 12-week window in Q4 2025 to Q1 2026, the median LinkedIn connection acceptance rate at C-level targets was 16 per cent. At IC level on the same accounts, the median was 54 per cent. The 3.4x gap between the lowest and highest title-seniority bands is the most predictive variable in the dataset. A single "30 per cent is good" benchmark is calibrated for nobody's actual outbound. The answer depends on the ICP mix you're sending to.
By Yana Safiullina
Quick answer
A good LinkedIn connection acceptance rate in 2026 depends on your ICP. The 40-account audit gives median rates of 16 per cent at C-level, 24 per cent at VP, 38 per cent at Director, and 54 per cent at IC. Title seniority explains roughly 60 per cent of the variance in our cohort. Vertical and message-length account for the rest, and they interact (short messages outperform at IC level, longer messages outperform at C-level). The take-home: baseline against your peer ICP segment, not against a flat cross-cohort number.
The audit: 40 accounts, 12 weeks, weighted segments
The cohort: 40 outbound accounts across five verticals (B2B SaaS, fintech, crypto, iGaming, consumer-tech-with-business-buyer). The window: 12 weeks from 13 October 2025 to 5 January 2026. Each account ran outbound to a defined ICP segment with a controlled connection-request approach (no scripts, individual review of each request, no bulk-import tools).
For each account we recorded: ICP segment of each connection target (title seniority + vertical), whether a message was attached and its character length, whether the connection was accepted, time-to-acceptance for accepted connections. The 40-account sample produced 18,400 connection requests with 5,940 accepted (32.3 per cent cross-cohort).
The 32.3 per cent figure is the cross-cohort number anyone reading a single-line benchmark gets. It's accurate. It's also useless: every account in the cohort had a different ICP mix and the cohort number doesn't tell any one of them whether their own acceptance rate is below, at, or above peer band. The point of segmenting is to make the number actionable.
Connection acceptance by ICP title
The single largest variance driver is title seniority of the connection target. The pattern is monotonic across the four bands.
| Title band | Median acceptance | 25-75 percentile (IQR) | Median time-to-acceptance |
|---|
| C-level (CEO, CFO, CMO, CTO, CRO) | 16% | 10–22% | 3.1 days |
| VP (VP Sales, VP Eng, VP Product, VP Marketing) | 24% | 18–31% | 1.8 days |
| Director (Director of X, Head of Y) | 38% | 29–46% | 1.1 days |
| IC (Senior IC, Manager, Senior Manager, Lead) | 54% | 44–63% | 0.6 days |
Three patterns inside the table. First, acceptance and speed move together: more senior targets accept less often and take longer when they do. Second, the IQR widens at higher seniority. There's more variance in C-level acceptance because individual circumstance (recent hiring, current vendor relationship, profile-warmth signals) matters more. Third, the IQR-low at C-level is 10 per cent, which is the rate any account sending exclusively to C-level should expect on a bad week.
A buyer with a 22 per cent acceptance rate who's sending 80 per cent to C-level and 20 per cent to VP is performing at the high end of the expected band for their ICP mix. The same buyer would be performing at the low end if they were sending 50/50 to Director and IC. The headline rate is the same; the interpretation flips entirely.
Connection acceptance by vertical
Vertical is the second-largest variance driver. The 40-account cohort split unevenly across verticals so the percentile bands are wider for the smaller samples.
| Vertical | Median acceptance | Sample size (accounts) |
|---|
| B2B SaaS | 34% | 14 |
| Fintech | 29% | 9 |
| Crypto | 41% | 6 |
| iGaming | 27% | 5 |
| Consumer-tech (B2B buyer) | 36% | 6 |
The vertical-level differences are smaller than the title-level differences (~14 percentage points spread vs ~38 percentage points spread). Within each vertical, the title-band pattern still holds. Crypto's higher cross-cohort median reflects the seniority-mix of the crypto-vertical accounts in the sample (more Director-level targets, fewer C-level) rather than a vertical-specific lift on like-for-like targets.
The implication: a fintech account benchmarking against the cohort-average 32.3 per cent number is benchmarking against a B2B-SaaS-heavy mix. Their peer band is 29 per cent at the median, with 19-37 per cent IQR. A fintech team at 25 per cent acceptance is performing within band, not below it.
Connection acceptance by message-length cohort
Message length interacts with title seniority in a way that flips the conventional "short messages are better" rule.
| Message length cohort | C-level | VP | Director | IC |
|---|
| No message attached | 14% | 22% | 36% | 56% |
| Short (1–80 chars) | 18% | 26% | 39% | 49% |
| Medium (81–200 chars) | 21% | 28% | 38% | 41% |
| Longer (200+ chars) | 23% | 27% | 32% | 33% |
Two observations. At IC level, the no-message and short-message cohorts outperform the longer-message cohorts. IC targets accept low-friction requests faster than they read long pitches. At C-level, the longer-message cohort outperforms the no-message and short cohorts by 9 percentage points (23 per cent vs 14 per cent). The cross-cohort takeaway ("send short messages") is true for the wrong segment.
The interaction explains a portion of the cohort variance after title seniority is controlled for. Teams that calibrate their message-length strategy to their target seniority outperform teams that apply one message-length rule across the ICP mix.
The factor that explains 60 per cent of cohort variance
Running a multivariate decomposition on the 40-account cohort with title-band, vertical, and message-length cohort as the three predictors, title seniority alone accounted for 60 per cent of the explained variance in connection acceptance rate. Vertical accounted for 18 per cent. Message-length cohort accounted for 14 per cent. The remaining 8 per cent fell to account-level idiosyncratic factors (profile-warmth signals, recent posts visible to the target, mutual-connection density, time-of-day, day-of-week).
The practitioner-side conclusion: when a team's outbound rate sits at 22 per cent and the manager wants to know whether that's good, the first question to ask is about the ICP-segment mix the team is sending to. The message template and the sending-tool are downstream questions. A 22 per cent rate at C-level-heavy outbound is high-band performance. The same rate at IC-heavy outbound is bottom-decile. Same number, opposite conclusion.
This pattern repeats across the reply-rate side of the same funnel where the 1-per-cent-vs-15-per-cent bimodal-distribution finding has its own segment dynamics. The connection-rate segmentation and the reply-rate segmentation are two layers of the same buyer-side calibration problem.
What this means if your current acceptance rate is X
Five interpretation patterns the audit suggests, by current cross-mix rate.
Below 10 per cent. Either the ICP-mix is C-level-extreme and the rate is within the IQR-low, or there's a profile-warmth or message-shape problem upstream of the request. Self-diagnostic: pull the last 50 connection requests, segment by title, and check whether the rate at each title band is below the percentile-low for that band. If yes at multiple bands, the problem isn't ICP mix.
10–25 per cent. Within the expected band if the mix skews C-level or VP. Probably below band if the mix is Director-heavy or IC-heavy. Self-diagnostic: same as above. The headline rate doesn't decide; the segment breakdown does.
25–40 per cent. Roughly average for cross-mix B2B outbound. The next-question is whether the conversation rate (acceptances that turn into reply-thread engagement) is high or low. Connection rate at this band is rarely the bottleneck; conversation rate often is. The sender-model question becomes more relevant at this stage than further connection-rate optimisation.
40–55 per cent. Above cohort median, likely Director-and-IC-heavy mix or strong profile-warmth signals. The next question for teams in this band is whether the IC-heavy mix is producing pipeline or just connections. IC targets have higher acceptance but lower budget authority. The full-cycle conversion read is the next layer of audit.
Above 55 per cent. Either IC-extreme mix (acceptance high but pipeline often weak) or operator-voice-profile (where profile-warmth lifts the curve across all bands). The pricing-tier breakdown for LinkedIn outreach agency models covers the cost shape of the operator-voice option versus alternatives.
The cross-platform read on benchmark-vs-vanity-metric distinction sits in the 10 questions to ask an X distribution vendor, which carries the same calibrate-by-segment discipline onto X-distribution evaluation.
The 15-minute how-to-baseline-your-own-outbound checklist
Seven yes/no checks the outbound manager runs on the team's last 90 days of LinkedIn connection requests. Five or more yes answers means the team is calibrated against the right peer band. Three or fewer means the team is chasing a single-number benchmark.
- Has the team segmented the last 90 days of connection requests by ICP title seniority (C-level, VP, Director, IC)?
- Does each title-band have at least 50 connection requests in the sample (smaller samples are too noisy to baseline against)?
- Are the per-segment acceptance rates compared against the segment's median + IQR from a benchmark (this audit or any other published cohort), not against a cross-cohort flat number?
- Has the team checked vertical-specific calibration (are they comparing fintech outbound to fintech benchmarks, not to B2B SaaS)?
- Has the team checked message-length-by-title interaction (longer messages at C-level, shorter at IC)?
- Does the team track conversation rate (accepted → reply thread) separately from connection rate? Connection rate is the entry metric; conversation rate is the qualification metric.
- Has the team avoided the single-rule fallacy (one message template across the full ICP mix; one cross-platform target across vertical)?
A team that scores three or fewer is optimising the wrong number. The fix is segment-then-baseline before any further iteration on message-shape or sending-tool.
The cross-cluster parallel on the same audit shape sits in the Reddit reputation pricing model breakdown and on the X side in vetting an X distribution vendor. Different metrics, different surfaces, same calibrate-by-segment discipline. The relevant cross-surface anchors for B2B teams thinking beyond LinkedIn are the LinkedIn resident network, the Reddit resident network, and the X KOL service, which are the three surfaces an outbound programme typically considers when LinkedIn calibration completes.
Why connection rate isn't the metric to optimise on
A 12-month back-test on 6 of the 40 audited accounts where we have downstream pipeline attribution showed the connection rate explained 14 per cent of pipeline outcome variance. The reply-thread engagement rate (post-connection back-and-forth depth) explained 31 per cent. The qualified-meeting rate (the meetings that progressed past first call) explained 47 per cent. Connection rate is the entry metric. It's a leading indicator that the outbound list is targeted credibly and the profile reads as legitimate. It's not the metric that decides pipeline.
Teams that optimise hard on connection rate often do so at the cost of downstream conversation rate. By sending shorter and less context-loaded requests to drive acceptance, they reduce the per-connection conversation value. The right framing is: hit the band for your ICP segment, then optimise on the conversation rate that's downstream of it.
Frequently asked
What is a good LinkedIn connection acceptance rate in 2026?
It depends on your ICP segment. The 40-account audit medians: C-level 16 per cent, VP 24 per cent, Director 38 per cent, IC 54 per cent. The cohort average of 32.3 per cent is technically correct and practically useless. Every team has a different ICP mix, and the right peer-band depends on the mix the team is sending to. A 22 per cent rate at C-level-heavy outbound is high-band; the same 22 per cent at IC-heavy outbound is below band.
What is the average LinkedIn connection rate for B2B sales?
Across the 40-account cohort spanning B2B SaaS, fintech, crypto, iGaming, and consumer-tech-with-business-buyer, the cross-cohort acceptance rate was 32.3 per cent. Vertical splits: B2B SaaS 34 per cent, fintech 29 per cent, crypto 41 per cent (sample skewed Director-heavy), iGaming 27 per cent, consumer-tech 36 per cent. The vertical-level differences are smaller than the title-level differences.
Does title seniority affect LinkedIn connection rate?
Yes. It's the largest single driver. Title seniority explained 60 per cent of cohort variance in our 40-account audit. The acceptance band runs from 16 per cent at C-level to 54 per cent at IC, a 38-point spread. Any benchmark that doesn't segment by title is averaging across this spread and producing a number that calibrates for nobody.
Should I send a connection message on LinkedIn?
It depends on the target's title. At IC level, no-message and short-message cohorts outperform longer messages by ~7-15 points. At C-level, longer messages (200+ chars) outperform no-message by 9 points. The cross-cohort rule "send short messages" is true for IC and roughly wrong for senior targets. Match message length to title-band rather than applying one rule across the mix.
How much does ICP title matter for LinkedIn acceptance?
Title seniority accounted for 60 per cent of the explained variance in connection acceptance rate in our cohort. Vertical accounted for 18 per cent. Message-length cohort accounted for 14 per cent. The remaining 8 per cent fell to account-level idiosyncratic factors. The practical implication: segment your benchmark by title first, then look at vertical and message-length as secondary calibrations.
What's the difference between connection rate and reply rate?
Connection rate is the percentage of connection requests that get accepted. Reply rate is the percentage of accepted connections that engage in a back-and-forth thread post-connection. They're sequential funnel metrics: connection rate is the entry, reply rate is the qualification layer. Connection rate explained 14 per cent of pipeline outcome variance in our back-test; reply-thread engagement rate explained 31 per cent; qualified-meeting rate 47 per cent. Connection rate is the entry signal, not the pipeline-deciding metric.
Is 30 per cent a good LinkedIn connection rate?
For cross-mix B2B outbound: roughly average. For Director-and-IC-heavy outbound: below band (you should be above 38 per cent at Director and above 54 per cent at IC). For C-level-heavy outbound: above band (median is 16 per cent at C-level, 24 per cent at VP). The number itself doesn't decide; the ICP mix decides whether the number is high or low.
If you want this benchmark run against your own outbound list
If you want the seven-question audit run on your last 90 days of LinkedIn connection requests with a per-segment baseline against the cohort, we can run it on a call. The benchmark works regardless of which sender-model the team uses. Twenty minutes, no charge.