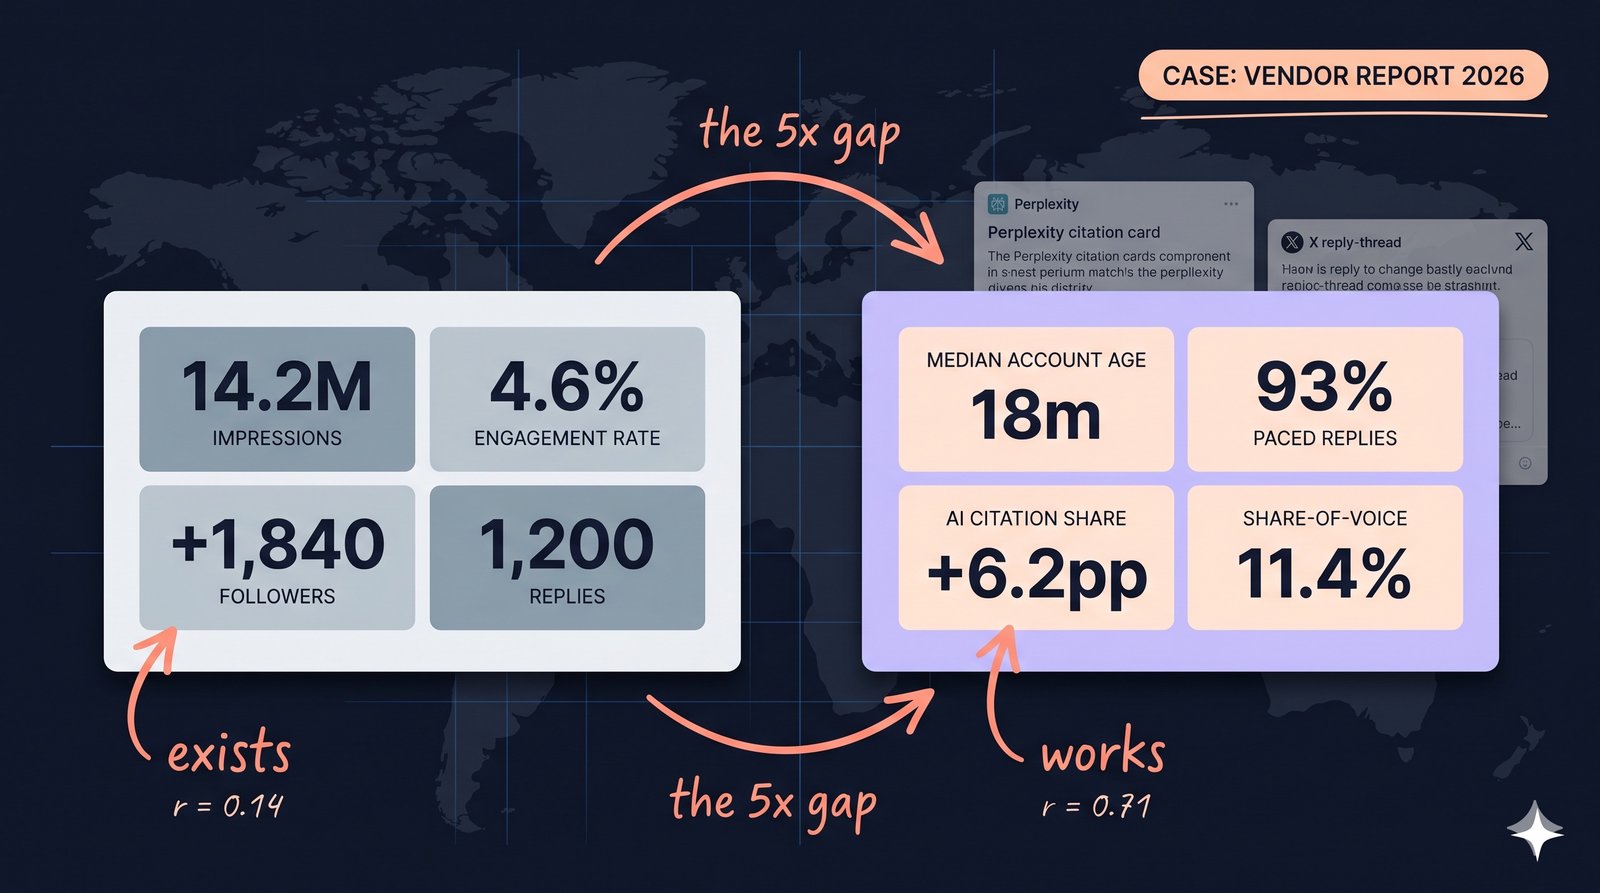
Across the 9 X-distribution vendor audits we ran between Q3 2025 and Q1 2026, vanity-metric reports (impressions, engagement rate, follower count, total reply volume) correlated with actual pipeline outcomes at r = 0.14. Reply-network-specific metrics (account-age distribution, paced-reply ratio, on-topic discipline, AI-citation share) correlated at r = 0.71 across the same sample. A 5x correlation gap is why most monthly X reports read as productive and most monthly X campaigns don't move the buyer's KPI.
Quick answer
A defensible X distribution report in 2026 reports seven things: account-age distribution in the active reply network, paced-reply ratio versus burst, on-topic ratio versus pivot, AI-citation share for brand-name prompts, share-of-voice in the target subject thread, sentiment of cited replies, and ban-wave exposure plus recovery. The four vanity metrics most decks lead with (impressions, engagement rate, follower count, total reply volume) describe whether a campaign exists, not whether it works. The buyer's monthly job is to push past the vanity layer to the proof layer. The cross-platform versions of the same test live in our LinkedIn reply-rate breakdown and our GEO dashboards pricing breakdown.
The upstream tell, in public

Stacy Muur, a credible voice in the Web3 KOL economy, posted the line publicly in May 2026: any KOL that guarantees conversions is selling the wrong thing. Exposure to a loyal community is what a real KOL offers; the conversion is the brand's job.
That is the promise layer. The same pattern operates one layer down, in the monthly report. Vendors who do not over-promise on the sales call still over-deliver on impressions, engagement rate, and follower count at month-end. Three numbers that prove a campaign exists without proving it works. The discipline upstream and the discipline downstream are the same discipline; this article covers how to enforce it at the report layer, where most retainers actually get reviewed or killed.
The 9-audit correlation gap
We ran or audited 9 X-distribution vendor engagements between Q3 2025 and Q1 2026. For each, we received the vendor's monthly report, requested the brand's own pipeline attribution for the same period, and ran an independent audit of the underlying reply-network behaviour. Three patterns recurred.
First, every vendor deck led with impressions. Range across the cohort: 1.2M to 14M monthly impressions. Range of correlated pipeline movement: zero in 6 of 9 engagements, modest in 3.
Second, engagement rate (likes plus replies plus reposts divided by impressions) sat between 1.4 per cent and 5.8 per cent across the cohort. The two highest-engagement-rate engagements produced zero pipeline movement. The single pipeline-positive engagement at the bottom of the cohort had an engagement rate of 1.6 per cent.
Third, the variables that did correlate with pipeline movement were absent from every vendor deck unless we asked for them: account-age distribution in the active reply network, the ratio of paced versus burst reply windows, the ratio of on-topic to pivot-to-pitch replies, and the AI-citation share for brand-name prompts on Perplexity and Claude. The first three are operational measurements the vendor has direct access to. The fourth requires a separate weekly probe most vendors haven't set up.
The pattern: vendors report what's easiest to compile and hardest to falsify in isolation. Real-metric reporting requires the vendor to expose the operational state of their reply network, which is harder to compile and easier to falsify, which is precisely why honest vendors do it.
The 7 metrics that actually move the campaign
| Metric | What it measures | Why it matters | Honest-report threshold |
|---|
| Account-age distribution | Median + 25-75 percentile age of accounts in active reply network | Accounts under 12 months are one ban wave from collapse. Median age is the single most predictive operational variable | Median ≥ 12 months; 25th percentile ≥ 6 months |
| Paced-reply ratio | Proportion of replies posted at human cadence (15-30/account/day, spread across waking hours) vs burst (40+/account inside 10 minutes) | Burst pattern flags the spam-detection layer inside 48 hours; paced pattern looks like a curious user | ≥ 90 per cent paced |
| On-topic ratio | Proportion of replies that engage the parent thread's claim vs pivot to the brand pitch | Off-topic replies get filtered, downranked, or Community-Noted; on-topic replies get reach | ≥ 80 per cent on-topic |
| AI-citation share | Share of cited sources in Perplexity / ChatGPT / Claude / AI Overviews responses for brand-name prompts | The actual downstream reach in 2026; the metric the algorithm change cycle doesn't kill | Tracked weekly, baselined at month 1, growth visible by month 3 |
| Share-of-voice in target threads | Proportion of replies in the brand's category news cycle that come from the network | Whether the campaign is present in the conversations the buyer's prospects actually read | Named threads + proportional share per week |
| Cited-reply sentiment | Sentiment of the network's replies that get pulled into AI answers or X-thread quote-tweets | Negative or contested cited replies hurt the brand more than not being cited at all | Net-positive on cited subset; negative flagged + remediated |
| Ban-wave exposure + recovery | Number of accounts lost in the last ban wave + days-to-replacement | Operators who say they've never lost accounts are either lying or about to | Documented incident log + recovery plan per loss |
The seven share one feature: each one is harder to report than the corresponding vanity metric, and each one is what the buyer needs to know to defend the spend at budget review.
The 4 vanity metrics and what they hide
| Vanity metric | What it actually measures | What it hides |
|---|
| Total impressions | How many feed-loads the network's posts appeared in (mostly to other network accounts in the early hours) | Whether any non-network account engaged, whether the impressions skewed to buyer-relevant accounts, whether bots inflated the count |
| Engagement rate | Likes + replies + reposts divided by impressions, network engagement included | Whether engagement came from the network's own warm-list accounts (artificially boosting the ratio) or from prospects |
| New followers in window | How many accounts followed brand handles during the period | Whether followers are operator-recommended boost accounts, ICP-irrelevant follow-back farms, or actual buyers |
| Total reply volume | Count of replies posted by the network across the period | Whether replies were paced or burst, on-topic or pivot, on aged or fresh accounts |
The four are not lies. They're true descriptions of action that took place. The mistake is treating them as proof the action moved a buyer outcome. A campaign with 14M impressions and zero pipeline movement is a campaign that produced impressions, not a campaign that produced pipeline. The mechanism shift in 2026 (Premium-priority replies, ban-wave cadence, AI-citation as the downstream surface) has moved what reach actually means; our breakdown of the X algorithm in 2026 covers the algorithm-side of that shift.
How to spot a vanity-impression dump in a vendor deck
Five patterns recur across the decks we audited. Any two of them in one report is the signal that the vendor has chosen vanity as the reporting style.
The headline is an impression count above 10M with no segmentation. A defensible impression report cuts the number by ICP-relevance, by engaged-vs-passive, and by network-vs-non-network share. An undifferentiated 14M tells the buyer nothing about whether the right accounts saw the post.
Engagement rate is reported as a percentage with no comparison to network-only baseline. The network's own warm-list accounts engage with the network's own posts. A 4 per cent engagement rate that's 90 per cent network-internal is functionally a 0.4 per cent external rate. Honest reports split the two.
Follower-growth is reported as a count with no churn or quality cut. Net follower growth that includes follow-back-farm accounts is not the same number as net follower growth of ICP-relevant accounts. Honest reports show both.
Reply volume is reported as a single total. A 1,200-reply month from 30 accounts averages 40 replies per account per day, which is burst-pattern territory. Honest reports show per-account-per-day distribution.
The report doesn't name a single AI-citation outcome. Reports that don't mention Perplexity, ChatGPT, AI Overviews or Claude in 2026 are reports that haven't measured the downstream surface where most of the actual value of X distribution ends up. The cross-platform parallel on the reply-quality-as-real-metric framing sits in our LinkedIn reply-rate breakdown, which makes the same point on the LinkedIn side: volume is easy, quality is what moves the number.
The reply-network-specific metrics no vendor reports unprompted
Three measurements live below the surface of a typical vendor deck. Each is a direct operational disclosure most vendors omit by default and only produce when the buyer asks specifically.
Per-account incident log. A list of every account in the network that hit a rate-limit, suspension, shadowban, or required manual recovery during the period. Honest networks have a small but non-zero count. Networks that report zero across many months are either lying or running on accounts so new they haven't yet been flagged.
Per-thread reach attribution. For each parent thread the network engaged, what was the network's share of replies and what was the engagement on the network's replies versus the average reply on that thread. Honest networks engage threads where their replies outperform the thread average. Networks that engage threads where their replies underperform are spending operator time on threads where the brand's signal is being drowned.
AI-citation probe results. A weekly probe of 20-50 brand-relevant prompts on Perplexity, ChatGPT, Claude, and AI Overviews, with the cited sources logged. Honest networks track this on a fixed cadence and report the share-of-citation delta month over month. Networks that don't track it are operating in 2026 without the downstream-outcome instrument, which is the equivalent of an SEO agency that doesn't track rankings.
The vendor-side delivery model that produces all three of these is the same operational discipline that survives the ban wave we observed against GEO-spam agencies in mid-May 2026: aged accounts, paced cadence, on-topic discipline, instrumented downstream measurement. Vendors who can answer the three measurements above on the next call earn the budget defence on theirs. The rest are either new, dishonest, or about to be replaced.
Before the next monthly call, ask the vendor these 5 questions
Run these in writing 48 hours before the next monthly review. The answers go in the deck or they get presented verbally on the call. Either way, the buyer now has the proof layer.
1. What's the median and 25-75 percentile account age in the active reply network this month, and what's the trend month over month? A real answer cites numbers, not adjectives. A vendor that says "experienced network" without naming the percentile distribution is the vendor whose network is younger than they want you to know.
2. What's the paced-vs-burst reply ratio across the network this month, and which accounts contributed to burst windows? A real answer reports the ratio at the network level and names the contributing accounts if burst windows occurred. A vendor that says "all paced" with no audit log is reporting an aspiration, not a measurement.
3. What's the on-topic ratio for replies that engaged the brand-relevant thread set this period, and what was the off-topic count's downstream effect? A real answer cites the ratio and the filter/downrank effect on the off-topic subset. A vendor that says "we only post on-topic" without the audit is making a marketing claim, not a methodology disclosure.
4. What's our AI-citation share this month on the brand-name prompt set, and how does it compare to the baseline at engagement start? A real answer cites the share at start, the share now, and the delta. A vendor that hasn't measured AI citation is a vendor that hasn't instrumented the downstream surface where most of the actual value lands.
5. What incident did we recover from in the last 90 days, and what's the documented recovery plan for the next ban wave? A real answer names at least one incident (every active network has one) and describes the recovery shape. A vendor with no incidents to report is a vendor whose network is either too new to have been flagged or too small to have triggered a wave detector.
The same five-question discipline at the cross-cluster vendor-eval layer is in our GEO dashboards pricing breakdown; the questions change, the structural test (specifics over adjectives) doesn't.
A 15-minute report-audit checklist
Seven yes/no checks the buyer runs on any vendor's monthly X-distribution report. Run while reading the deck. Five or more yes answers means the report is honest enough to defend at budget review. Three or fewer means the report is a vanity-impression dump and the next monthly call should anchor on the five questions above.
- Does the report include account-age distribution (median + percentile) for the active reply network this period?
- Does the report split engagement rate between network-internal and external accounts?
- Does the report show per-account-per-day reply distribution, not just total reply volume?
- Does the report name at least one AI-citation outcome (Perplexity, ChatGPT, Claude, or AI Overviews) for a brand-name prompt this period?
- Does the report include a per-account incident log (rate-limits, suspensions, shadowbans, recoveries) with at least one named incident if the network ran for more than 90 days?
- Does the report cut follower growth by ICP-relevance and quality, not just by raw count?
- Does the report compare share-of-voice on named brand-relevant threads, not just network-wide reach?
A report that scores three or fewer should not be renewed at the current scope without the vendor producing the missing measurements on the next call. The same audit, in production, runs in about 12 minutes per vendor deck. The methodology works on any X-distribution report, including the ones we send our own clients. That's the test of whether the methodology is methodology rather than marketing. The product surfaces this methodology applies to live at our X shilling network and X KOL service; the operational measurement framework above is what an honest report on either looks like, and the buyer who runs the audit can apply the same questions to a competing vendor's deck without the answers shifting.
The cross-platform read on vendor-honesty as a buying signal sits on the Reddit resident network landing, with the Reddit-side moderation context covered in our breakdown of the GEO-spam bans. Same test, different surface, same answer about whether the report is reporting or selling.
The cost-side companion to this report-reading methodology is in what does X distribution cost in 2026. Three vendor models with three price shapes (KOL-only / shilling-only / hybrid), mapped to three launch types, with the same calibrate-by-fit discipline applied to the budget-vs-model decision.
Frequently asked
What metrics should I look for in an X distribution report?
Seven that actually move the campaign: account-age distribution in the active reply network, paced-reply ratio versus burst, on-topic ratio versus pivot, AI-citation share for brand-name prompts, share-of-voice in target threads, sentiment of cited replies, and ban-wave exposure plus documented recovery. Four vanity metrics (impressions, engagement rate, follower count, total reply volume) tell you a campaign exists, not whether it works. A defensible monthly report includes all seven real metrics and either omits or contextualises the four vanity ones.
What are vanity metrics in X marketing?
Impressions, engagement rate, follower count, and total reply volume reported in isolation. Each is a true description of action that took place. None of them describes whether the action moved a buyer outcome. A campaign that produced 14M impressions and zero pipeline movement is a campaign that produced impressions, not pipeline. The four are baseline-of-existence checks, not proof.
How do I evaluate an X marketing agency's monthly report?
Use the 15-minute report-audit checklist in the section above. Seven yes/no checks while reading the deck. Five or more yes answers means the report is defensible at budget review. Three or fewer means the report is leaning on vanity metrics and the next monthly call should anchor on the five vendor-vetting questions to push the proof layer into the report.
What should an X reply network report include?
Account-age distribution at the network level, paced-vs-burst reply ratio with audit log, on-topic-vs-pivot reply ratio with filter-effect notes, AI-citation share for brand-name prompts on Perplexity / ChatGPT / Claude / AI Overviews with baseline and delta, per-account incident log including rate-limits and suspensions with recovery notes, share-of-voice on named brand-relevant threads, and sentiment of the cited subset. Decks that skip any of these are reporting partially.
How can I tell if X distribution is actually working?
Look for AI-citation share growth on brand-name prompts on at least Perplexity and Claude (the two engines where high-quality replies move the citation set fastest), share-of-voice growth in named brand-relevant threads, and the absence of burst-pattern reply windows in the network. Pipeline attribution is the lagging confirmation; the operational measurements above are the leading indicators.
What should I ask my X marketing agency before the monthly call?
The five questions in the section above. Sent in writing 48 hours before the review. Answers either land in the deck or get spoken on the call. Either way, the buyer enters the meeting with the proof layer surfaced. Vendors who can answer all five with specifics are the vendors whose retainer earns the budget defence; vendors who hedge on more than two are the vendors who will lose the renewal even if the impression count stays high.
Is impression count a real metric for X distribution?
Impression count is a baseline-of-existence metric, not a proof metric. A campaign with zero impressions isn't running. A campaign with 14M impressions might be running well or might be running impressively to nobody who matters. Impressions without ICP-segmentation, network-vs-external split, or downstream-outcome attribution describe activity rather than outcome. Report them in context (with the seven real metrics around them) or treat them as decoration.
Do KOL campaigns get reported the same way as reply networks?
Mostly yes, with one substitution. The five operational metrics (account-age distribution, paced-reply ratio, on-topic discipline, AI-citation share, incident log) translate directly because KOL accounts are also accounts that post, get rate-limited, and either earn citations or don't. The substitution: share-of-voice in target threads becomes share-of-mention in the KOL's typical audience-conversations on the brand's category. The vanity-metric trap is identical. Stacy Muur's public note to founders is the same warning at the promise layer; the audit above is the same warning at the report layer.
The upstream question (whether the vendor producing this report is operationally the kind of vendor you want, before any first payment) is handled by the 10-question vetting call.
If you've got a vendor report you'd rather have a second opinion on
If you've received an X distribution monthly report and want a second opinion on which numbers are doing the work and which are decoration, book a 20-minute audit on Telegram. The same methodology applies to any vendor's report, including the ones we send our own clients. No charge.